| country | inflation_rate | exports_gdp_share | gdp_growth_rate | gdp_per_capita | adult_literacy_rate | primary_school_enrolment_rate | education_expenditure_gdp_share | measles_immunisation_rate | health_expenditure_gdp_share | income_inequality | unemployment_rate | life_expectancy | total_population | |
|---|---|---|---|---|---|---|---|---|---|---|---|---|---|---|
| 0 | Afghanistan | NaN | 18.380042 | -6.240172 | 352.603733 | NaN | NaN | NaN | 68.0 | NaN | NaN | 14.100 | 62.879 | 41128771.0 |
| 1 | Albania | 6.725203 | 37.395422 | 4.856402 | 6810.114041 | 98.5 | 95.606712 | 2.74931 | 86.0 | NaN | NaN | 11.588 | 76.833 | 2777689.0 |
| 2 | Algeria | 9.265516 | 31.446856 | 3.600000 | 5023.252932 | NaN | 108.343933 | NaN | 79.0 | NaN | NaN | 12.437 | 77.129 | 44903225.0 |
| 3 | American Samoa | NaN | 46.957520 | 1.735016 | 19673.390102 | NaN | NaN | NaN | NaN | NaN | NaN | NaN | NaN | 44273.0 |
| 4 | Andorra | NaN | NaN | 9.563798 | 42350.697069 | NaN | 90.147346 | 2.66623 | 98.0 | NaN | NaN | NaN | NaN | 79824.0 |
World Development Indicators Analysis (2022)
1 Introduction
This report analyses selected indicators from the World Development Indicators (WDI) dataset for the year 2022 (worldbank2022?).
The objective is to explore relationships between economic and social development variables across countries, particularly the link between income levels and human development outcomes (todaro2015?).
1.1 Data
1.2 GDP per Capita Analysis
count 203.000000
mean 20345.707649
std 31308.942225
min 259.025031
25% 2570.563284
50% 7587.588173
75% 25982.630050
max 240862.182448
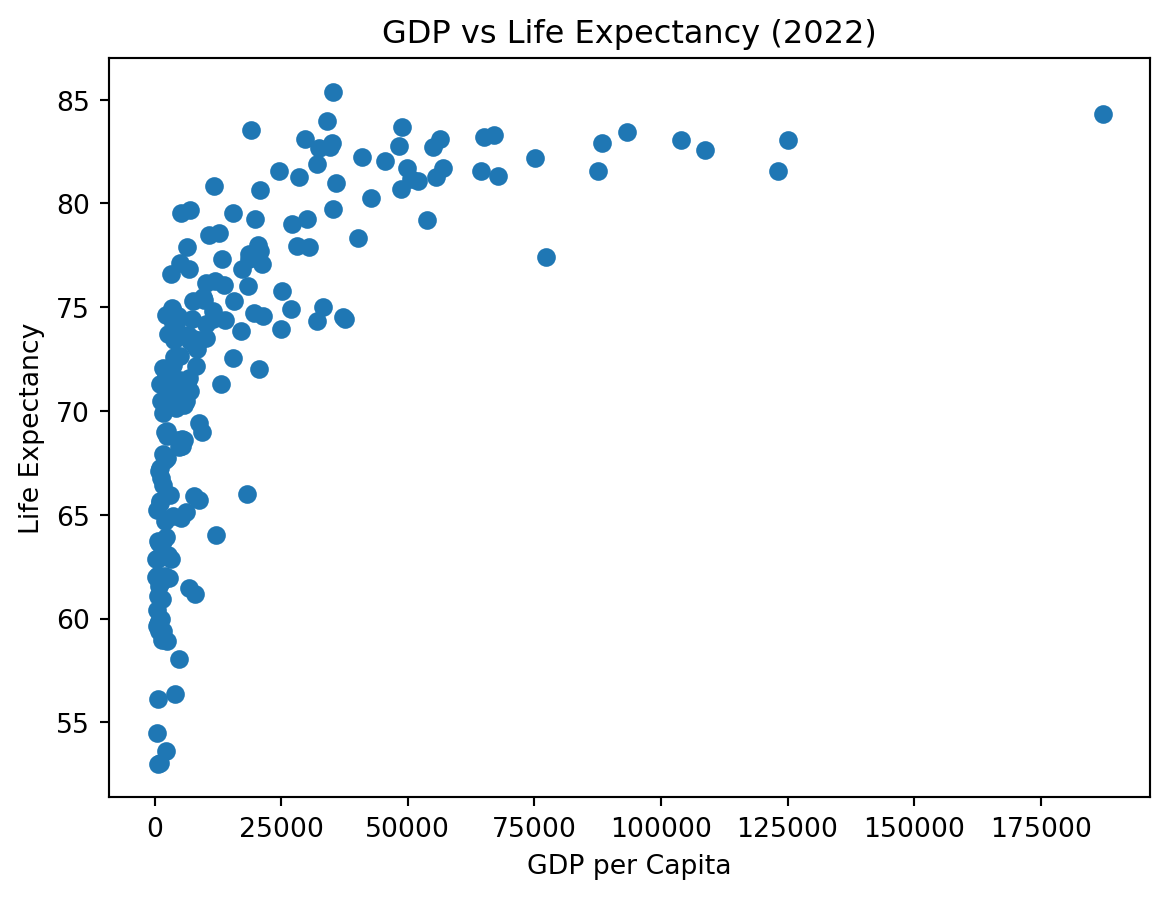
Name: gdp_per_capita, dtype: float64As shown in Figure 1, there is a clear positive relationship between GDP per capita and life expectancy across countries.
1.3 Top 10 Countries by GDP per Capita
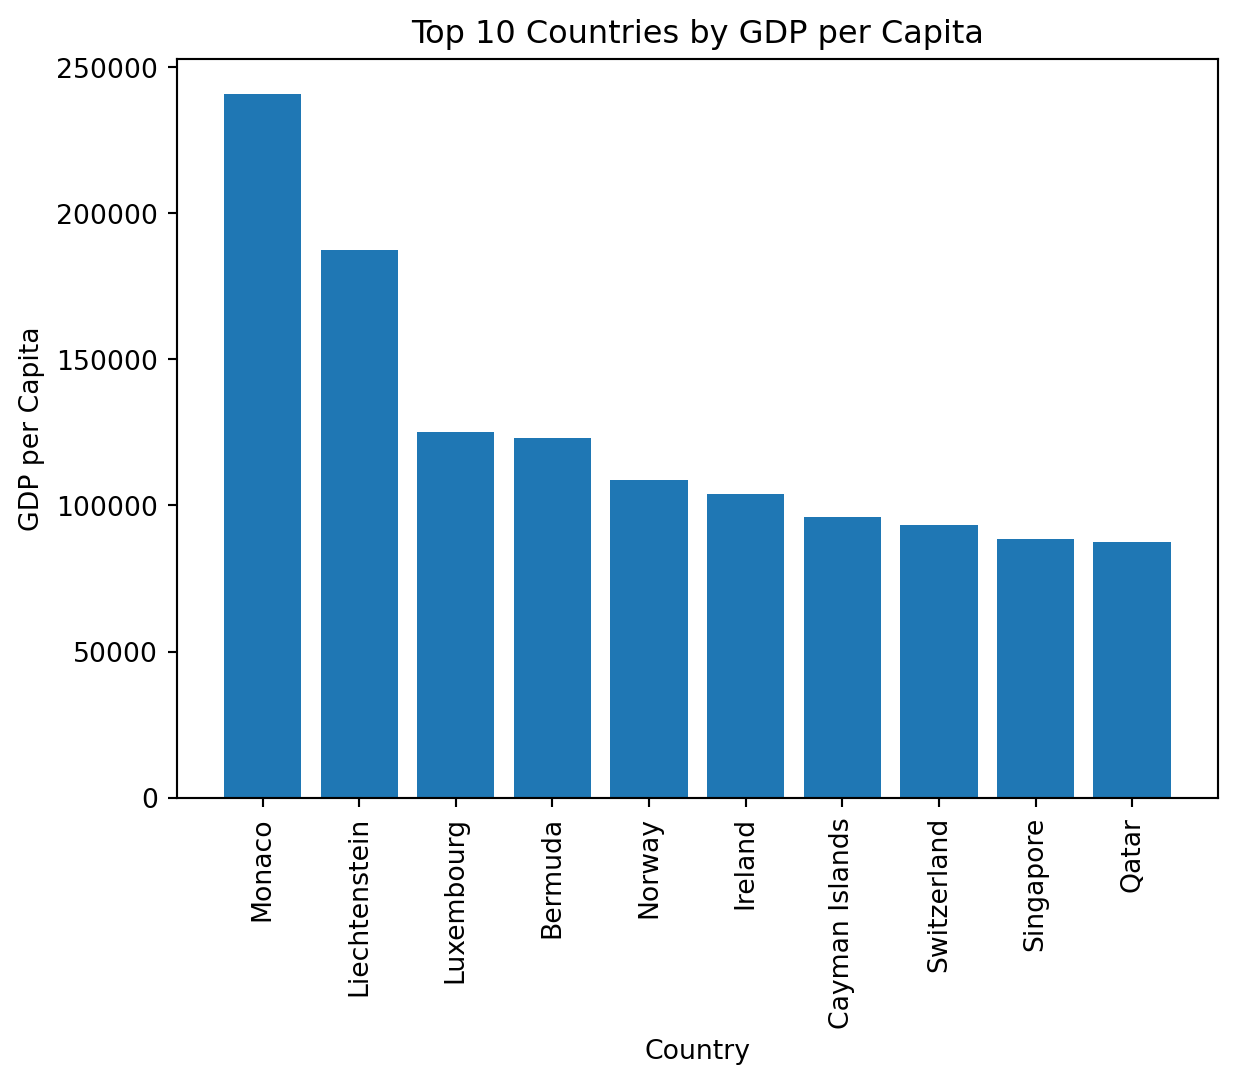
Figure Figure 2 highlights the countries with the highest GDP per capita in 2022.
1.4 Summary Statistics
Table Table 1 presents descriptive statistics for the selected development indicators.
| gdp_per_capita | life_expectancy | unemployment_rate | |
|---|---|---|---|
| count | 203.000000 | 209.000000 | 186.000000 |
| mean | 20345.707649 | 72.416519 | 7.268661 |
| std | 31308.942225 | 7.713322 | 5.827726 |
| min | 259.025031 | 52.997000 | 0.130000 |
| 25% | 2570.563284 | 66.782000 | 3.500750 |
| 50% | 7587.588173 | 73.514634 | 5.537500 |
| 75% | 25982.630050 | 78.475000 | 9.455250 |
| max | 240862.182448 | 85.377000 | 37.852000 |
The summary statistics reveal substantial inequality in income levels across countries. GDP per capita ranges from very low-income economies to extremely high-income economies, with a large standard deviation indicating strong dispersion. Life expectancy shows less variation than income, suggesting that improvements in income are associated with diminishing health gains at higher levels of development. Unemployment rates vary considerably, reflecting differences in labour market structures and economic stability across countries.